

I wrote a tool that pings 392 cloud regions from your VPS in about a minute

I wrote a tool that pings 392 cloud regions from your VPS in about a minute
Short version: a single static binary you drop on a VPS, a router or a CI runner. It measures latency, jitter and packet loss from that machine to 392 regions of 22 cloud providers: AWS, Azure, GCP, Oracle, Hetzner, OVHcloud, DigitalOcean, Vultr, Linode, Scaleway, Alibaba Cloud and more.
curl -fsSL https://m2c.1ms.dog/i | sh
It opens a menu; press Enter through the defaults and it starts. To run it once without installing anything:
curl -fsSL https://m2c.1ms.dog/i | sh -s -- run
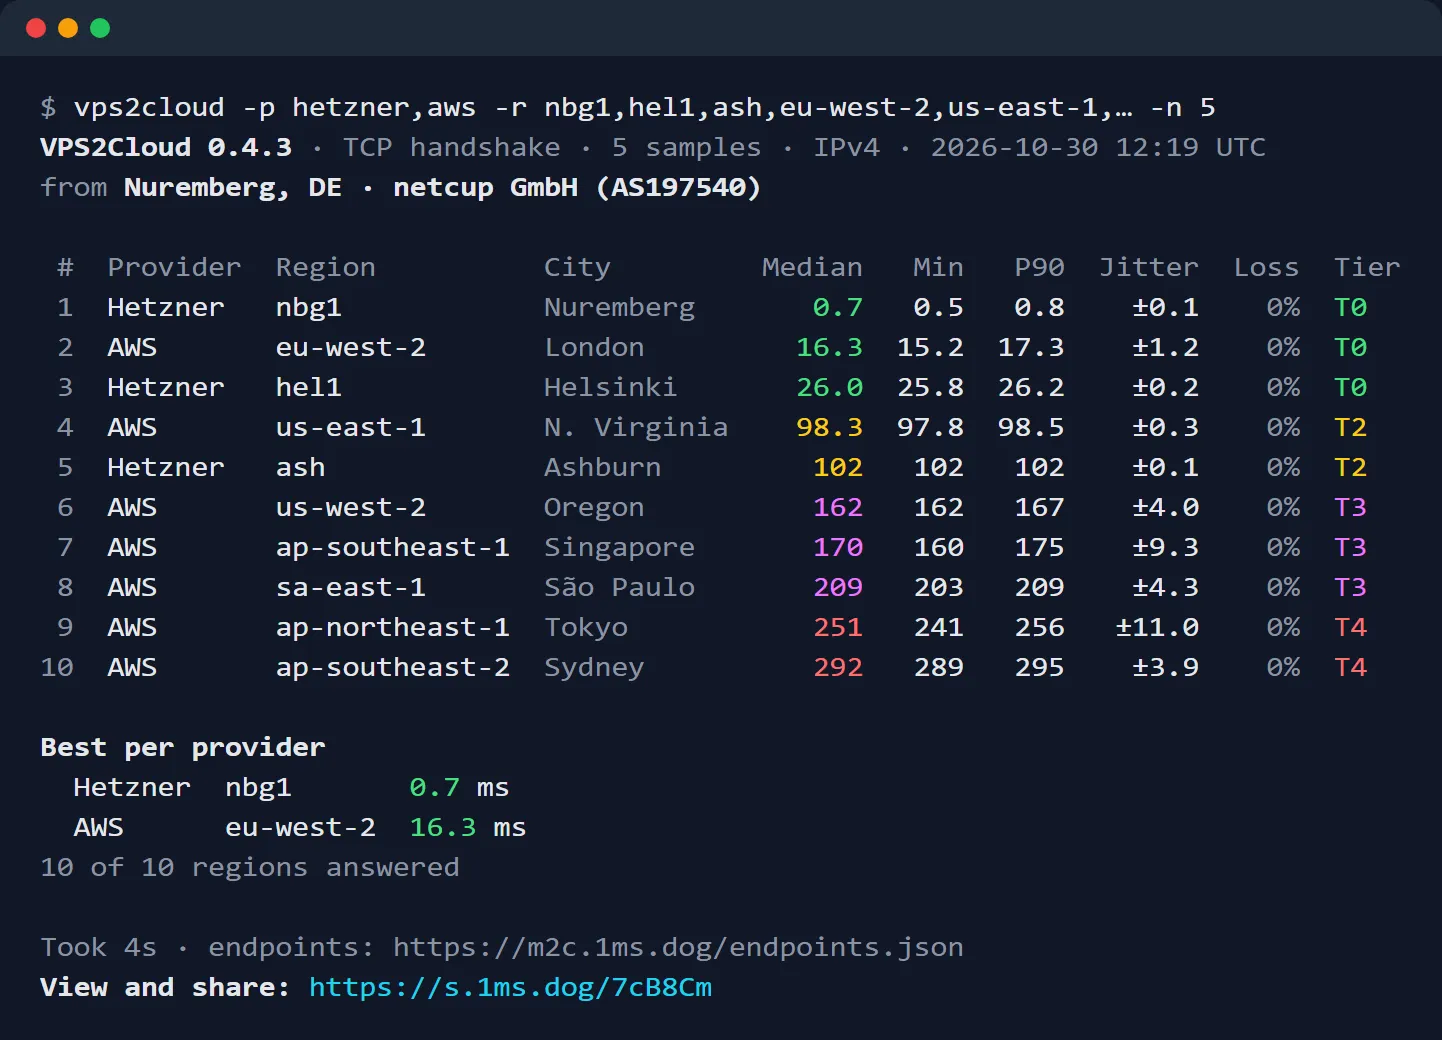
Why I built it
The question was boring: which region of which cloud is closest to the box I already have?
Say you have a netcup VPS in Germany and want object storage for backups, or a nearby region for an API. AWS Frankfurt or London? How far apart are Hetzner's Helsinki and Nuremberg from where you sit? The usual routine is a dozen looking glass tabs, or pinging a list of IPs by hand. A looking glass measures from their network to you, which is the wrong direction, and every provider has its own page, so nothing ends up in one table. Pinging by hand means first finding the right address for each region, and plenty of clouds don't answer ICMP or rate-limit it.
So I put the test endpoints for 392 regions into one list and wrote something that tests them all and hands back a sorted table.
How it measures
The default is a TCP handshake: open a connection to the region's HTTPS port, time SYN to SYN-ACK, close it. No TLS, no HTTP request, so the number is the network round trip and nothing else. No server processing time mixed in, which makes it the fairest way to compare regions.
There are two other methods, and you can run all three:
-m https: a request on a reused HTTPS connection, timed to the response headers. A bit of server processing time gets in, but it's closer to what an app actually feels.-m icmp: plain ping, needs root. Some networks deprioritize ICMP, and Naver Cloud doesn't answer it at all.-m all: all three side by side, so you can see the difference yourself.
For each region you get median, min, P90, jitter (the average difference between consecutive samples) and loss, plus a tier based on the median: T0 ≤ 30 ms, T1 ≤ 80, T2 ≤ 150, T3 ≤ 250, T4 above that.
Why it takes a minute. On a 1 vCPU / 1 GB netcup box in Nuremberg, all 392 regions at 10 samples each (3,920 samples) took 1 minute 16 seconds. It's fast because regions are tested in parallel (24 hosts at once by default). One region after another would take over 20 minutes.
Parallel doesn't mean hammering, though. Each host only ever has one sample in flight, with a 250 ms pause between samples. At most 4 regions per provider run at once, and a region is dropped after 3 failures in a row. A default run sends each region 10 handshakes, total. These are someone else's public endpoints; being polite is the baseline, and it also keeps rate limiting from polluting the numbers.
It's one half of a pair, with Me2Cloud
vps2cloud is the command-line side of Me2Cloud. Between them they answer two halves of one question:
- Me2Cloud (web) runs in your browser and measures your home network → each cloud. Your ISP, your Wi-Fi and the evening peak all count. It answers "which region is fast for me, or for my users".
- vps2cloud (CLI) runs on a server and measures this machine → each cloud. It answers "which region is close to this VPS" and "where should my proxy, relay or CDN origin point".
Both use the same endpoint list and the same tiers and scoring. The list is maintained in the Me2Cloud repo, every endpoint is checked weekly, and the CLI syncs it daily. One caveat: a browser can only measure over HTTPS, while the CLI defaults to a TCP handshake, so the web numbers carry a few ms of server processing time. If you want the two to line up exactly, run the CLI with -m https.
The nice part: when the CLI finishes it prints a share link, and that link opens the full result in Me2Cloud, sortable, with the distribution chart. The run above looks like this on the web:
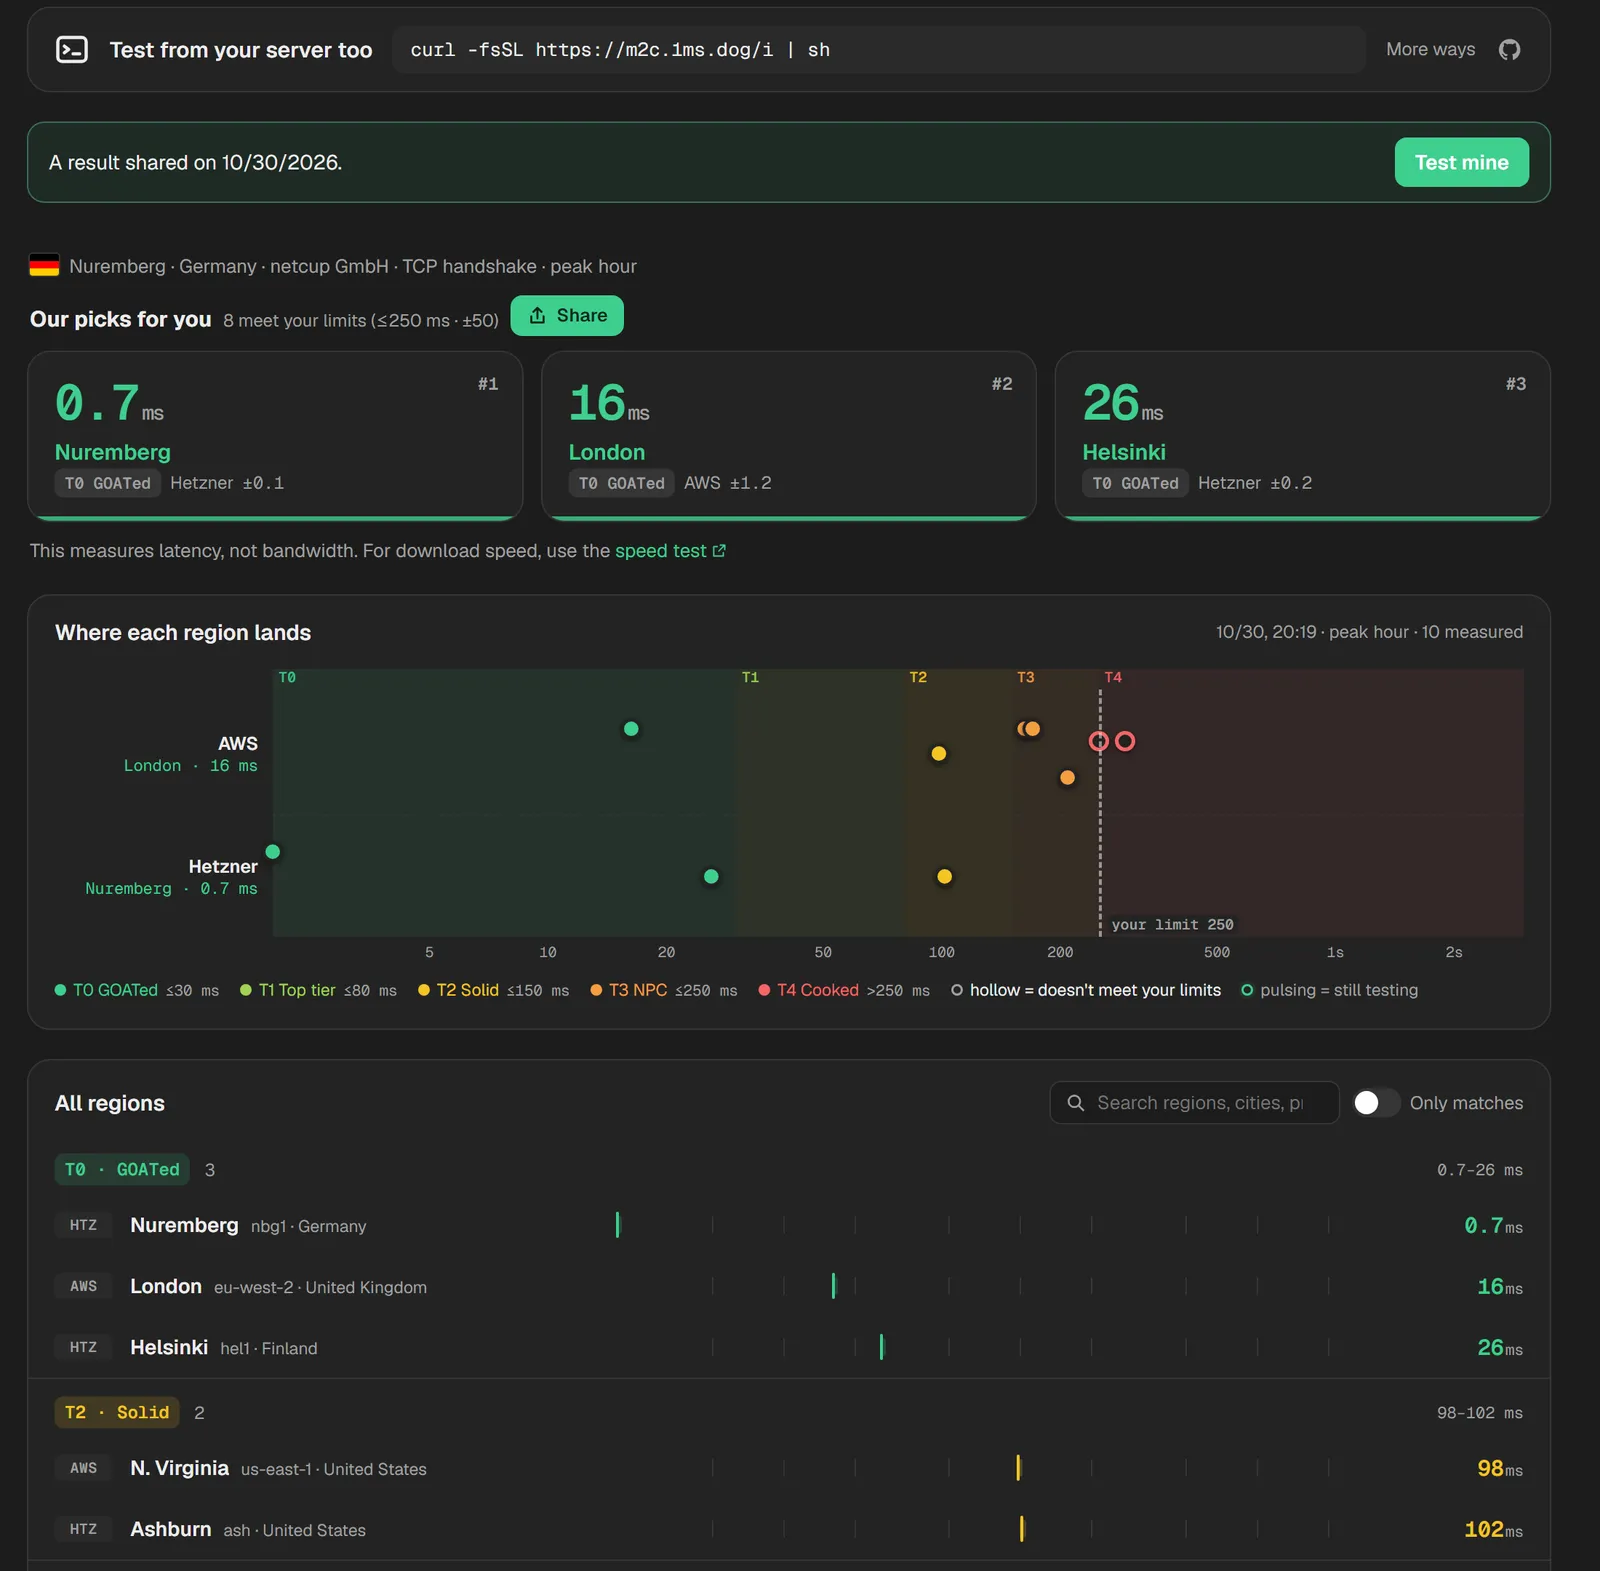
How I use the pair: test from home with Me2Cloud to see which regions are fast for me (or my users), then run vps2cloud on the candidate VPS to see how the server reaches those same regions. Now I know both ends of the path.
Things I run a lot
vps2cloud -p aws,gcp -r 'eu-*'     # AWS and GCP, European regions only
vps2cloud --continent as --top 10  # Asia, the 10 fastest
vps2cloud --ip both                # IPv4 and IPv6 in one run, one report with two parts
vps2cloud --cdn                    # nearest edge of 6 CDNs (Cloudflare, Akamai, CloudFront, ...)
vps2cloud --preset game            # mark regions good for gaming (median ≤ 60, jitter ≤ 10, no loss)
vps2cloud -o md                    # also save a Markdown table, ready to paste into a forum post
It also works in CI or cron as a check:
vps2cloud -p hetzner --max-ms 50                 # exit code 3 if even the best region is above 50 ms
vps2cloud -o json --stdout | jq '.regions[0]'    # JSON into a pipe
Details
- One static binary, no dependencies. Linux on amd64, arm64, armv7, 386 and riscv64, plus mips and mipsle for OpenWrt routers. Also macOS, FreeBSD and Windows (in PowerShell:
irm https://m2c.1ms.dog/i.ps1 | iex). - Downloads work where GitHub doesn't. Install and self-update try
m2c.1ms.dog/dl/first (it serves the GitHub Release files) and fall back to GitHub. Either way the binary is checked against the release'schecksums.txt, and releases carry GitHub build provenance, so you can rungh attestation verifyyourself. - Want to read the installer first? It's install.sh in the repo, under 100 lines.
- 10 languages. It asks once on first run and remembers. Menus, tables and Markdown follow the language; JSON and CSV keys stay English.
Privacy, spelled out
Besides the measurement, it makes these requests: it fetches the endpoint list (that request is how runs are counted; the User-Agent carries only the version and OS/architecture), asks Cloudflare which city and network the machine is in, creates a short link, and checks for updates at most once an hour.
The short link deserves its own paragraph. To give you s.1ms.dog/xxxx, the full link is stored on s.1ms.dog, and the full link is the result: the per-region numbers and the exit city and network. Your IP address is never in it unless you add --show-ip.
If you don't want the result stored anywhere, add --long-link: you get the full link with the result after the #, which browsers never send to a server. --offline also skips the endpoint list download and the update check.
What it can't tell you
- It measures each provider's public API or object storage endpoint in a region, not an actual VM. Servers in the same region usually share that network, but premium routes (say Lightsail vs EC2, or a provider's optimized transit) can differ.
- Round-trip latency only. No bandwidth, no traceroute.
- A TCP handshake is the network round trip; if what you care about is how an app feels, use
-m https.
Links
- CLI: https://github.com/yt1988/vps2cloud (MIT)
- Web: https://m2c.1ms.dog
The endpoint list surely has gaps and stale entries. If a provider or region is missing, or one looks clearly wrong, reply here or open an issue and I'll check it. And I'd like to see what your boxes are closest to, so feel free to post your share links.
Comments
nice👍
Let me have a try.
Thank you for sharing this, yt1988, and especially for explaining the difference between the TCP, HTTPS and ICMP methods in plain terms. I am still learning how to judge a VPS, and I had assumed a single ping number was enough, so seeing median, P90 and jitter side by side helped me understand why one fast result can still feel uneven. For a beginner choosing a region for backups from a first VPS, would the TCP result usually be enough to start with, or is it worth running the HTTPS method as well because that is closer to how an app actually feels?